Ultimate Guide to API Performance Metrics
Ultimate Guide to API Performance Metrics
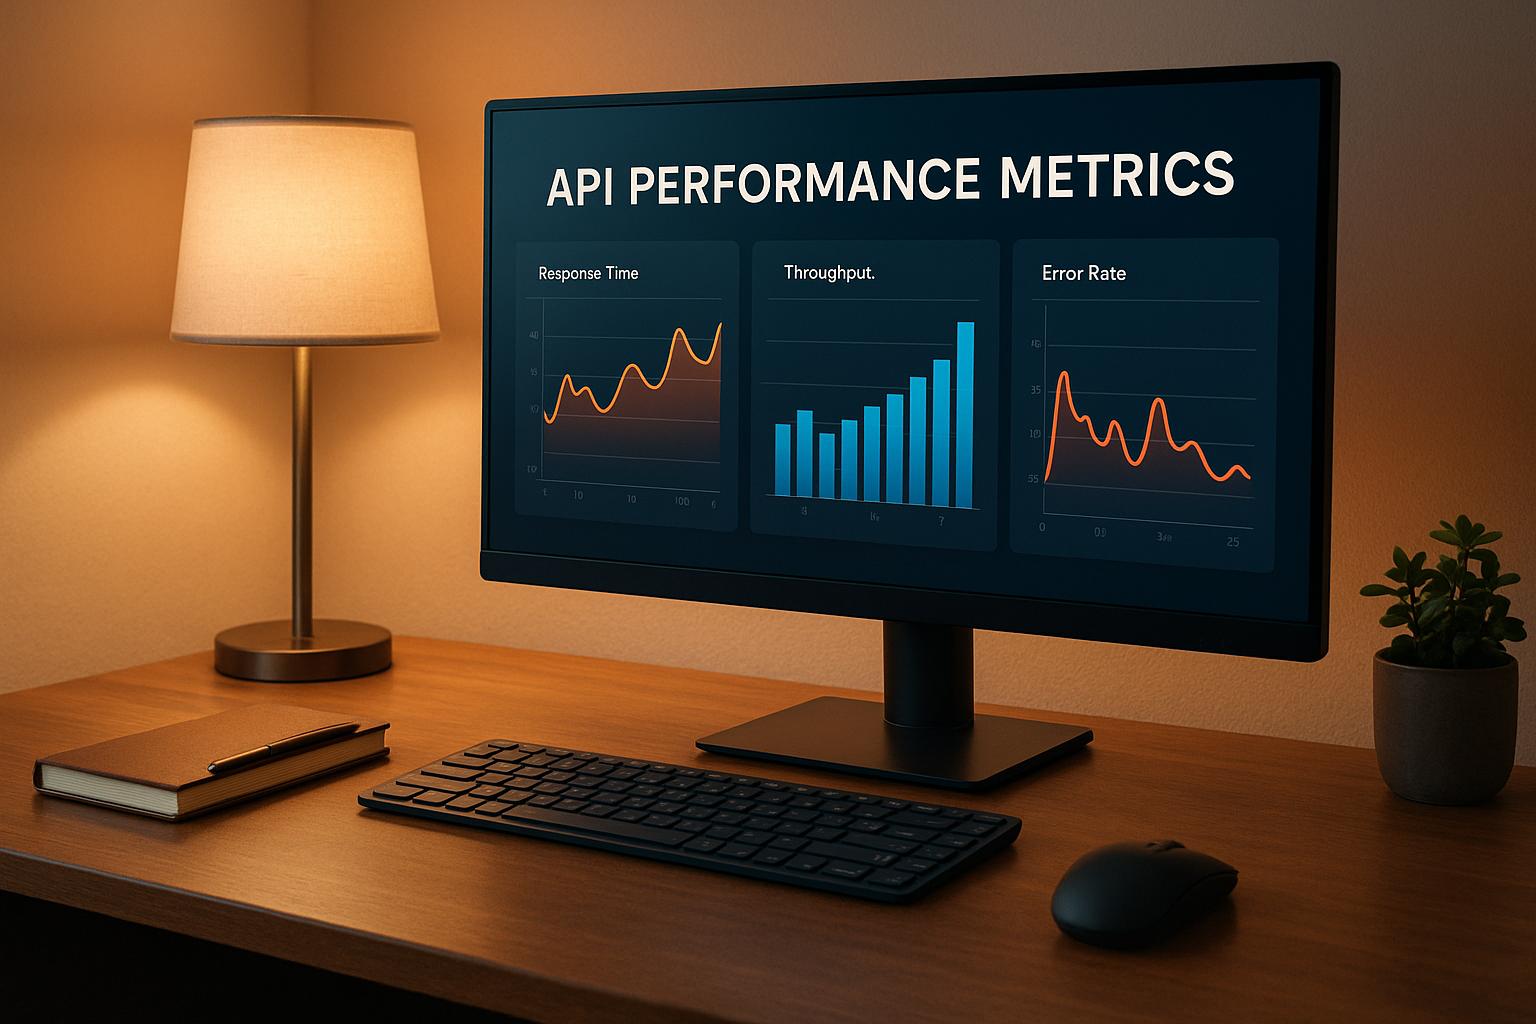
API performance metrics are critical for ensuring your applications run smoothly and meet user expectations. This guide breaks down the key metrics, tools, and practices to monitor and improve API performance effectively. Here's what you need to know:
Key Metrics to Track:
- Response Time & Latency: Measures how quickly your API responds to user requests. Even a 100ms delay can impact user satisfaction and revenue.
- Throughput: Tracks how many requests your API handles per second, ensuring scalability during traffic spikes.
- Uptime & Availability: Indicates the percentage of time your API is operational. Aim for at least 99.9% uptime.
- Error Rate: Monitors the percentage of failed requests, helping you identify and fix issues promptly.
Monitoring Tools:
- Popular tools like Datadog, New Relic, and open-source options like Prometheus help track these metrics in real-time.
- Combine server-side, client-side, and log-based monitoring for a complete view of performance.
Best Practices:
- Use caching, database optimization, and payload compression to minimize response times.
- Implement rate limiting and load balancing to handle high traffic volumes.
- Set clear Service Level Objectives (SLOs) to maintain consistent quality.
Example: CarsXE, a vehicle data API, processes 2 million daily requests with an average response time of 120ms and 99.9% uptime. This level of performance ensures reliability for tasks like VIN decoding and market value lookups.
Measure What Matters: 14 Key API Success Metrics Explained!
Key API Performance Metrics to Track
To keep your API running smoothly and meeting user expectations, tracking the right performance metrics is crucial. These metrics provide insights into how your API is performing and help you make informed decisions to improve its reliability and efficiency.
Response Time and Latency
Response time measures the total duration from when a request is made to when a response is received, including both processing and network delays. On the other hand, latency focuses specifically on the network delay involved in a data packet's round trip. Both are critical for user satisfaction, but they affect it in different ways.
Amazon famously found that every additional 100 milliseconds of latency could cost them 1% in revenue. Additionally, delays exceeding 300 milliseconds can significantly reduce user engagement. Understanding these metrics is essential for evaluating how well your system handles traffic under load.
Throughput and Scalability
Throughput refers to how many requests your API can handle within a given time frame, often measured in requests per second (RPS) or requests per minute. This metric reflects your API's ability to manage production traffic, especially during sudden spikes. For example, vehicle data APIs might experience a surge in VIN decoding requests during peak car shopping seasons, with hundreds of lookups happening at once as users browse online inventories.
Since APIs power much of today's web traffic, high throughput is non-negotiable. However, high throughput paired with frequent errors signals underlying issues. To plan for scalability, monitor traffic patterns, peak usage times, and seasonal trends. Many APIs see usage spikes during events like Black Friday, tax season, or back-to-school shopping. Preparing for these surges ensures your API can handle the load without breaking.
Uptime and Availability
Uptime measures how often your API is operational, while availability expresses this as a percentage of time the API successfully responds to requests. Most APIs aim for an uptime of 99.9% or higher, with "Five Nines" availability (99.999%) translating to just 5.26 minutes of downtime per year. In contrast, "1 Nine" availability (90%) allows for a staggering 36.5 days of downtime annually.
Stripe, for example, achieved 99.9999% uptime during the 2022 Black Friday and Cyber Monday weekend, equating to just 31.5 seconds of downtime for the entire year. During this period, they handled over 20,000 requests per second and processed more than $3 billion in daily transactions.
Monitoring availability requires more than basic ping tests. True availability checks whether your API can process real business requests, not just respond to health checks. Geographic factors also play a role, as an API might perform well in one region but face issues in another due to network disruptions. Tools like real-time monitoring, failover systems, and load balancing across regions can help maintain consistent service.
Error Rate and System Reliability
Error rate represents the percentage of API requests that fail or return errors, directly influencing user trust and overall system reliability. High error rates often signal deeper issues that need immediate attention. For instance, 43% of companies report losing over $1 million per month due to API problems like slowdowns and outages. Common causes include timeouts, authentication failures, rate limiting, and downstream service disruptions.
Metric What It Measures Target Range Business Impact Request Latency Response delay < 100 ms Affects user experience and engagement Failed Request Rate Error percentage < 0.1% Impacts system reliability and trust Availability Uptime percentage > 99.9% Ensures service accessibility Resource Utilization System capacity usage 60–80% Balances efficiency with adequate headroom
To reduce error rates, set up alerts for spikes and analyze failed requests to identify recurring issues. For example, every additional second of delay can lower conversion rates by 7%, and delays beyond three seconds drive away nearly half of users. Keeping error rates under 0.1% ensures smooth interactions, fostering user confidence in your API.
Monitoring Tools and Techniques
Picking the right monitoring tools and techniques can mean the difference between catching issues early and losing the trust of your customers. The world of API monitoring offers everything from robust enterprise platforms to lightweight open-source tools, catering to various business needs and technical demands. Let’s dive into the tools and approaches that help teams stay on top of API performance.
Overview of Monitoring Tools
API monitoring tools act like an early warning system, keeping tabs on response times and error patterns across your API ecosystem. They go beyond simple uptime checks to provide a deeper look at how your APIs perform in real-world conditions.
Take Datadog, for example. It’s a unified platform with over 400 integrations, making it ideal for large-scale, distributed systems. Similarly, New Relic offers full-stack monitoring with strong cloud integrations. If you’re working with a tighter budget, Sematext offers flexible, pay-as-you-go pricing, while Better Stack provides a free tier alongside options for freelancers and larger teams. For those needing more insights into user behavior, Moesif combines API monitoring with analytics to show how customers interact with your APIs.
The choice between open-source and proprietary tools often depends on your team’s resources and expertise. Open-source solutions like Prometheus and Grafana are highly customizable and backed by strong community support, but they require manual setup and maintenance. Proprietary platforms, on the other hand, are easier to set up, offer dedicated support, and come with pre-built features, though they might be pricier.
Data Collection Methods
Effective API monitoring relies on gathering data from multiple angles to get a complete picture of system health. Combining technical performance metrics with real user experiences is key.
- Real-time Metric Tracking: Tools like Prometheus collect performance data instantly, helping you identify issues within seconds.
- Server-side Monitoring: This method digs into the internal workings of your API, tracking resource usage, database queries, and third-party dependencies. While offering deep insights, it requires proper instrumentation of your code.
- Client-side Monitoring: By measuring response times and error rates from the user’s perspective, client-side monitoring can uncover performance variations across regions or networks using browser APIs.
- Log Aggregation and Analysis: Logs provide a detailed record of API interactions. Analyzing these logs in real-time can help detect patterns signaling potential issues and is invaluable for investigating incidents or planning capacity.
It’s also crucial to secure monitoring endpoints with proper authentication to prevent unauthorized access while still enabling legitimate data collection. By combining server-side, client-side, and log analysis methods, you can gain a well-rounded view of your API’s performance under different scenarios.
Comparing Monitoring Solutions
When choosing a monitoring solution, it’s important to balance features, costs, and scalability. The market offers a variety of options, each with its strengths and trade-offs.
Tool Category Best For Key Strengths Considerations Enterprise Platforms Large, distributed systems Comprehensive features, integrations Higher cost, complex setup Mid-Market Solutions Growing businesses Balanced features and pricing May lack advanced enterprise features Specialized Tools Specific use cases Deep expertise for niche needs Limited scope outside their specialty Open Source Custom setups Full control, no licensing fees Requires technical know-how
For example, tools that integrate into your CI/CD pipeline can automate testing and enable continuous performance monitoring. This is especially useful for APIs like those from CarsXE, which handle endpoints for VIN decoding, vehicle specs, and market values. Consistent performance across all these endpoints requires coordinated monitoring.
Scalability is another key factor. A tool that works well with a few thousand requests per day might falter under sudden traffic spikes. Check how pricing scales with usage and whether the platform can handle increased demand without degrading performance.
Alerting capabilities also vary widely. Basic tools may offer simple threshold-based alerts, but advanced platforms use historical data to minimize false positives and ensure notifications reach the right team members.
Finally, the user experience of a platform can make or break its adoption. An intuitive interface reduces the learning curve, encouraging teams to actively use the monitoring data to drive decisions. These considerations lay the groundwork for improving performance and meeting service level objectives.
Best Practices for Improving API Performance
After setting up monitoring tools, the next step is implementing strategies to enhance your API's performance. These methods aim to reduce response times, handle traffic surges, and ensure reliability - key factors for meeting both user expectations and business goals.
Optimizing Response Time and Latency
To fine-tune performance, it's important to differentiate between latency (time to first byte) and the full response time. This distinction helps target optimizations more effectively.
- Caching: Caching is one of the quickest ways to improve response times. By using multi-level caching (client-side, server-side, and CDNs), you can reduce response times by up to 70% and cut costs. Combining short-term (e.g., in-memory) and long-term (e.g., Redis or CDN) caching strategies ensures both speed and data accuracy.
- Database optimization: Streamline database performance with techniques like proper indexing, pagination, simplified joins, and connection pooling. These adjustments help your database handle load more efficiently.
- Payload optimization: Reducing the size of data transfers can significantly speed up responses. Use compression methods like gzip or Brotli, which can improve compression ratios by 17–25%. For even smaller payloads, consider Protocol Buffers, which are 3–10 times more compact than JSON.
- Geographic distribution: Locating APIs closer to users can reduce latency by as much as 70%. CDNs can further enhance performance by serving content from the nearest server.
Here’s a quick guide to API response time benchmarks:
Response Time User Experience Application Suitability 0.1 seconds Feels instantaneous Real-time applications 0.1–1 second Slight delay, still smooth Most web applications 1–2 seconds Acceptable for many uses Non-critical operations 5+ seconds Unacceptable, leads to drop-offs Should be avoided
- Connection optimization: Use techniques like connection reuse (keep-alive), HTTP/2, and TLS/SSL session resumption to reduce handshake overhead and improve efficiency.
These optimizations lay the groundwork for handling high traffic volumes while maintaining solid performance.
Handling High Request Volumes
Once you've optimized response times, the next challenge is managing high traffic effectively. This involves techniques like rate limiting, caching, and efficient processing to prevent system overload and ensure consistent service quality.
- Rate limiting: Protect your API from excessive use by setting limits on requests. Use multiple tiers (per second, minute, hour, day) to handle different traffic patterns. A centralized store, like Redis, can track limits across servers for consistent enforcement in distributed systems.
Here’s a comparison of rate-limiting algorithms:
Algorithm Best For Key Benefits Trade-offs Token Bucket Variable, bursty traffic Allows spikes while capping total usage More complex to implement Leaky Bucket Steady, consistent traffic Smooth request processing Delays legitimate bursts Fixed Window Simplicity Easy to implement Risk of spikes at boundaries Sliding Window Smooth traffic distribution Avoids edge-case spikes Higher computational overhead
- Dynamic rate limiting: Adjust thresholds in real time based on server load. This approach can reduce server strain by up to 40% during peak times.
- Asynchronous processing: Offload long-running tasks to background queues, allowing your API to handle more requests simultaneously. This is especially useful for tasks like data validation or external service calls.
- Batch processing: Combine related requests into a single operation to reduce overhead and improve efficiency.
Maintaining Scalability and Availability
After addressing speed and traffic, focus on scalability and system uptime to keep your API reliable.
- Horizontal scaling: For fluctuating traffic, adding more server instances is a practical solution. Stateless APIs and load balancers make this approach seamless, distributing traffic evenly and improving fault tolerance.
- Load balancing: Distribute incoming requests across servers to avoid bottlenecks. Use health checks to route traffic only to functioning servers, and consider algorithms that factor in server capacity and response times for better efficiency.
- Auto-scaling: Automatically adjust infrastructure based on metrics like CPU usage, memory, or request queues. Cloud platforms often offer auto-scaling tools that respond to demand within minutes.
- Circuit breaker patterns: Prevent cascading failures by halting requests to failing services temporarily, giving them time to recover without affecting the entire system.
- Graceful degradation: During high load, temporarily disable non-essential features to maintain core functionality. Design your API to separate critical tasks from secondary ones to ensure key operations remain accessible.
- Connection pooling: Reuse database or external service connections to minimize the overhead of establishing new ones.
For example, CarsXE's vehicle data APIs - used for VIN decoding and market value lookups - require both low latency and high availability to maintain user trust. Coordinated scaling ensures these APIs can handle real-time demands without sacrificing performance.
Lastly, adopting an event-driven architecture can improve scalability and resilience. By enabling asynchronous communication between components, this setup allows services to scale independently while isolating faults more effectively than traditional synchronous systems.
sbb-itb-9525efd
Setting Up Service Level Objectives (SLOs)
Once you've improved performance, the next step is to ensure that quality remains consistent over time. This is where Service Level Objectives (SLOs) come into play. These act as clear benchmarks to maintain the high standards you've worked hard to achieve.
Understanding SLOs and SLAs
Service Level Objectives (SLOs) are internal goals that help ensure your API meets user expectations. Think of them as measurable targets that keep your team focused on delivering a reliable experience. On the other hand, Service Level Agreements (SLAs) are formal contracts with customers that set specific service commitments - and spell out consequences like financial penalties or service credits if those promises aren’t kept.
"A service level objective (SLO) is an internal target you set to ensure the services you deliver meet customers' expectations. These customer expectations are outlined in service level agreements (SLAs), agreements between you and the customer." - Atlassian
Here’s a quick comparison between SLOs and SLAs:
Aspect SLO SLA Purpose Internal targets to meet customer expectations Legal agreements with guaranteed service levels Flexibility Can be adjusted based on technical constraints Requires agreement from all parties Consequences Internal alerts and actions Financial penalties or service credits Focus Guides engineering priorities Defines contractual obligations
For example, if you're running a vehicle data API (like one for VIN decoding or market valuations), a reasonable SLO might aim for 99.9% uptime. This allows for about 43.2 minutes of downtime per month, which provides enough leeway to meet SLA commitments even during maintenance or unexpected disruptions.
Setting Performance Targets
When defining SLOs, aim for targets that challenge your team to improve but remain realistic enough to maintain customer trust. Start by analyzing historical performance data from the past three to six months to identify patterns and recurring issues. This will give you a solid foundation for setting achievable goals.
Some key metrics to consider:
- Response Time: For 95% of requests, aim for under 300ms. For real-time data, like VIN decoding, shoot for under 200ms.
- Availability: If your SLA guarantees 99.9% uptime, set an internal goal slightly higher to allow for a buffer.
- Error Rate: Keep error rates below 2% for standard APIs. For more critical data, such as recall information, aim for 0.5% or less.
- Throughput: Base this on expected traffic patterns and peak usage times.
It’s important to set SLOs below 100%. This creates an "error budget" - a small margin of acceptable failure that helps balance reliability with innovation. For instance, a 99.9% uptime target translates to about 43.2 minutes of allowable downtime per month. This approach ensures your team can experiment and improve without over-engineering.
Finally, collaborate with product, engineering, and support teams to ensure these targets align with both technical capabilities and customer expectations.
Tracking and Adjusting SLOs
SLOs aren’t a "set it and forget it" tool - they require ongoing monitoring and adjustment. Use dashboards to track compliance in real time, and set up alerts so you can act quickly if thresholds are at risk of being breached.
Plan regular reviews to keep your SLOs relevant:
- Monthly reviews: Check performance against current targets.
- Quarterly evaluations: Reassess whether the SLOs still align with business goals, user needs, and technical capabilities.
During these reviews, ask yourself:
- Are the SLOs still aligned with customer expectations?
- Have business priorities shifted, requiring new targets?
- Do performance trends suggest adjustments are needed?
- Have new tools or technologies unlocked the potential for better performance?
When targets are missed, treat it as a learning opportunity. Conduct post-incident reviews to identify root causes and implement fixes that prevent recurrence. This process not only improves your systems but also helps refine your SLOs over time.
Experimentation can also be useful. For example, A/B testing allows you to trial new features or optimizations on a small segment of traffic, so you can measure their impact before rolling them out to everyone.
Remember, SLOs are more than just metrics - they’re a way to prioritize what matters most. If you consistently exceed your targets, it could mean your systems are overbuilt and could be simplified. On the flip side, frequent misses might suggest your goals are too ambitious or that your infrastructure needs investment.
"SLOs are a tool to help determine what engineering work to prioritize." - Steven Thurgood and David Ferguson
API Metrics for Vehicle Data APIs
When it comes to vehicle data APIs, precision takes on a whole new level of importance. These systems aren’t just about handling data - they’re about managing real-time, highly detailed information with speed and reliability. From decoding VINs to running diagnostic checks, these APIs need to handle complex data relationships and varying payload sizes without missing a beat.
The Need for Real-Time Data
For vehicle data APIs, speed isn’t just a nice-to-have - it’s a necessity. Tasks like VIN scanning demand near-instant responses, setting the bar for performance extremely high. For example, decoding a VIN might involve pulling up detailed vehicle specs, market values, and recall histories - all in a fraction of a second. Similarly, OBD diagnostic lookups need to provide immediate feedback during vehicle inspections to keep troubleshooting on track.
Throughput is another critical factor. These APIs must handle both regular and peak traffic seamlessly. And error rates? They’re not just a technical metric - they can have real financial consequences. A single error in decoding or valuation could lead to costly mistakes, so keeping error rates below 1% is essential. With these stringent requirements in mind, CarsXE’s performance metrics stand out as a prime example of how a well-designed API can meet these challenges.
CarsXE's API Performance
CarsXE doesn’t just meet high standards - it sets them. Processing 2 million API calls daily, CarsXE achieves an impressive 120ms average response time and boasts 99.9% uptime. These numbers aren’t just statistics; they reflect a system built to handle enterprise-level demands without sacrificing speed or reliability.
The 120ms response time is particularly impressive when you consider the complexity of vehicle data queries. A single VIN decode request often pulls from multiple databases to compile a wide range of information. Achieving such quick responses requires a combination of optimized database queries, effective caching strategies, and a robust network infrastructure.
Andy Liakos, CEO of MotorTango, shared his thoughts on CarsXE’s impact: "CarsXE offers MotorTango's customers fast and accurate car data, setting a standard of excellence that stands unmatched by its competitors... enhancing our customers' overall experience and satisfaction".
Then there’s the 99.9% uptime - an absolute must for automotive businesses. Whether it’s weekend car shopping or the end-of-month sales crunch, even brief downtime can disrupt critical operations. CarsXE’s reliability ensures businesses can count on the platform when it matters most.
Performance Optimization with CarsXE
CarsXE doesn’t just deliver great performance - it actively works to maintain and improve it. The platform offers a developer-friendly dashboard with real-time monitoring tools, allowing teams to track API usage, identify bottlenecks, and fine-tune their integration strategies.
One key to CarsXE’s efficiency is its approach to payload optimization. Instead of forcing developers to retrieve an entire vehicle profile, the RESTful API design lets users request specific data subsets - like market value or recall information. This keeps payloads smaller and response times faster.
Metrics like Time to First Byte (TTFB) are also closely monitored to pinpoint potential performance issues. CarsXE’s 120ms response time demonstrates how backend processes, such as database queries, have been fine-tuned to minimize delays and reduce processing overhead.
Proactive monitoring plays a big role, too. By setting up alerts for response time spikes, error rate increases, or drops in throughput, teams can address issues before they impact users. This real-time oversight ensures that CarsXE remains reliable, even during peak business hours.
Conclusion
Keeping a close eye on API performance metrics is no longer optional - it's a must. APIs now drive 83% of all web traffic, and when issues arise, the stakes are high. In fact, 43% of companies report losing over $1 million each month due to API-related problems. Even small delays can be costly; latencies over 100ms negatively impact user experience, and companies like Amazon lose 1% of sales for every additional 100ms of delay.
The main takeaway? You can’t improve what you don’t measure. Accurate metrics are the foundation for effective optimization. A solid API management strategy relies on real-time monitoring, proactive adjustments, and clear benchmarks. Whether you're analyzing response times, throughput, uptime, or error rates, consistent tracking is the key to maintaining dependable API performance.
For vehicle data APIs, this is even more critical. McKinsey predicts the automotive software and electronics market will grow at a 5.5% annual rate from 2019 to 2030. Take PSA Corporation Ltd in Singapore as an example: in 2021, they launched over 50 haulage APIs that managed 100,000 container movements in their first year. These numbers show how well-optimized APIs can lead to measurable success.
CarsXE’s approach to performance metrics sets a strong example. By prioritizing fast response times and high uptime, the platform ensures automotive businesses can rely on real-time access to crucial vehicle data, whether it’s for VIN decoding, market valuations, or other essential tasks. This level of reliability supports seamless operations and enables businesses to deliver personalized services, real-time diagnostics, and location-based features. In a competitive market, maintaining top-tier API performance is essential for staying ahead.
To keep your APIs running at their best, ongoing monitoring is non-negotiable. Regular testing, thorough endpoint coverage, and continuous analysis are vital. Together, these practices ensure that your APIs - especially vehicle data APIs - remain reliable, efficient, and ready to meet the demands of modern users. Performance, after all, is what keeps APIs relevant and impactful in today’s fast-paced digital landscape.
FAQs
What are the best practices for using caching to improve API response times and reduce latency?
To get the most out of your API and keep latency to a minimum, caching can be a game-changer. By storing frequently accessed data, you can cut down on repetitive backend calls and reduce computational strain. Tools like in-memory caching or API Gateway caching can help improve response times and ease the load on your servers.
For caching to work effectively, it's essential to set up cache keys and expiration times properly. Cache keys ensure each request is uniquely identified, while well-planned expiration times keep your data current and relevant. These steps not only speed things up but also create a smoother experience for your users.
What are the best practices for setting and managing Service Level Objectives (SLOs) to maintain optimal API performance?
To keep your API running smoothly, start by setting clear, measurable Service Level Objectives (SLOs) that match what your users need and what your business aims to achieve. These objectives give you a solid foundation to track reliability and spot areas that need attention.
Whenever possible, automate the process of tracking these SLOs. Bring key stakeholders into the conversation to ensure the metrics you choose genuinely reflect what matters most for performance. Keep it simple - focus on the metrics that have the biggest impact. Be ready to adjust targets as needed, whether due to error budgets, scheduled maintenance, or changing demands.
By regularly fine-tuning your SLOs and staying ahead of potential issues, you'll ensure your API delivers reliable performance that meets user expectations.
What should I consider when choosing the best monitoring tool for my API?
When choosing an API monitoring tool, it's important to prioritize how well it fits with your existing infrastructure, whether it can handle future growth, and its ability to monitor key metrics like response time, latency, error rates, uptime, and resource usage. These capabilities are critical for keeping your APIs running smoothly.
You’ll also want to consider tools that provide seamless integration, customizable alerts, and in-depth data analysis. These features make it easier to detect and fix problems quickly. Finally, make sure the tool matches your technical needs, budget, and long-term plans, so it can adapt as your API demands evolve.
Related Blog Posts
- Auto Insurance API Integration Checklist
- VIN Decoder API: 7 Key Features to Look For
- How to Integrate Vehicle Data API in 5 Steps
- Slow Vehicle Lookups? API Solutions That Work