Ultimate Guide to OCR Pipeline Monitoring
Ultimate Guide to OCR Pipeline Monitoring
OCR pipeline monitoring is all about ensuring your system accurately extracts text from images while identifying and fixing errors quickly. This is especially critical in vehicle data workflows, where even a minor mistake - like a single wrong digit in a 17-character VIN - can disrupt insurance claims and compliance processes. Beyond accuracy, modern OCR systems must also address issues like "hallucination", where fabricated text is produced.
Key takeaways:
- Steps in an OCR pipeline: From image input to object detection, text recognition, and post-processing, each stage must work seamlessly.
- Deployment options: Cloud, edge, and hybrid setups each have unique benefits depending on speed, privacy, and connectivity needs.
- Metrics to track: Performance (latency, throughput), model quality (CER, WER), and data quality (resolution, blur, skew) are essential to monitor.
- Tools for monitoring: Use Prometheus, Grafana, and OpenTelemetry for real-time tracking, and set up tiered alerts for quick issue resolution.
- Error prevention: Validate VINs with checksum checks and track input drift to adapt to changes in data sources or formats.
Monitoring OCR pipelines is about more than accuracy percentages - it’s about building reliability across every stage. By focusing on metrics, tools, and proactive maintenance, you can ensure your system stays efficient and error-free.
Automating a Streaming Pipeline with OCR on Databricks Lakehouse
sbb-itb-9525efd
How OCR Pipelines Work in Real-Time Applications
OCR Pipeline Stages: From Image Input to Vehicle Data
Real-time OCR involves a series of carefully orchestrated steps, not just a single operation. In vehicle data workflows, even a minor issue in one step can throw off the entire process - whether you're decoding a VIN, matching a vehicle history record, or performing a license plate lookup. To keep these systems running smoothly, it's important to understand how each step contributes to the overall pipeline.
Steps in an OCR Pipeline
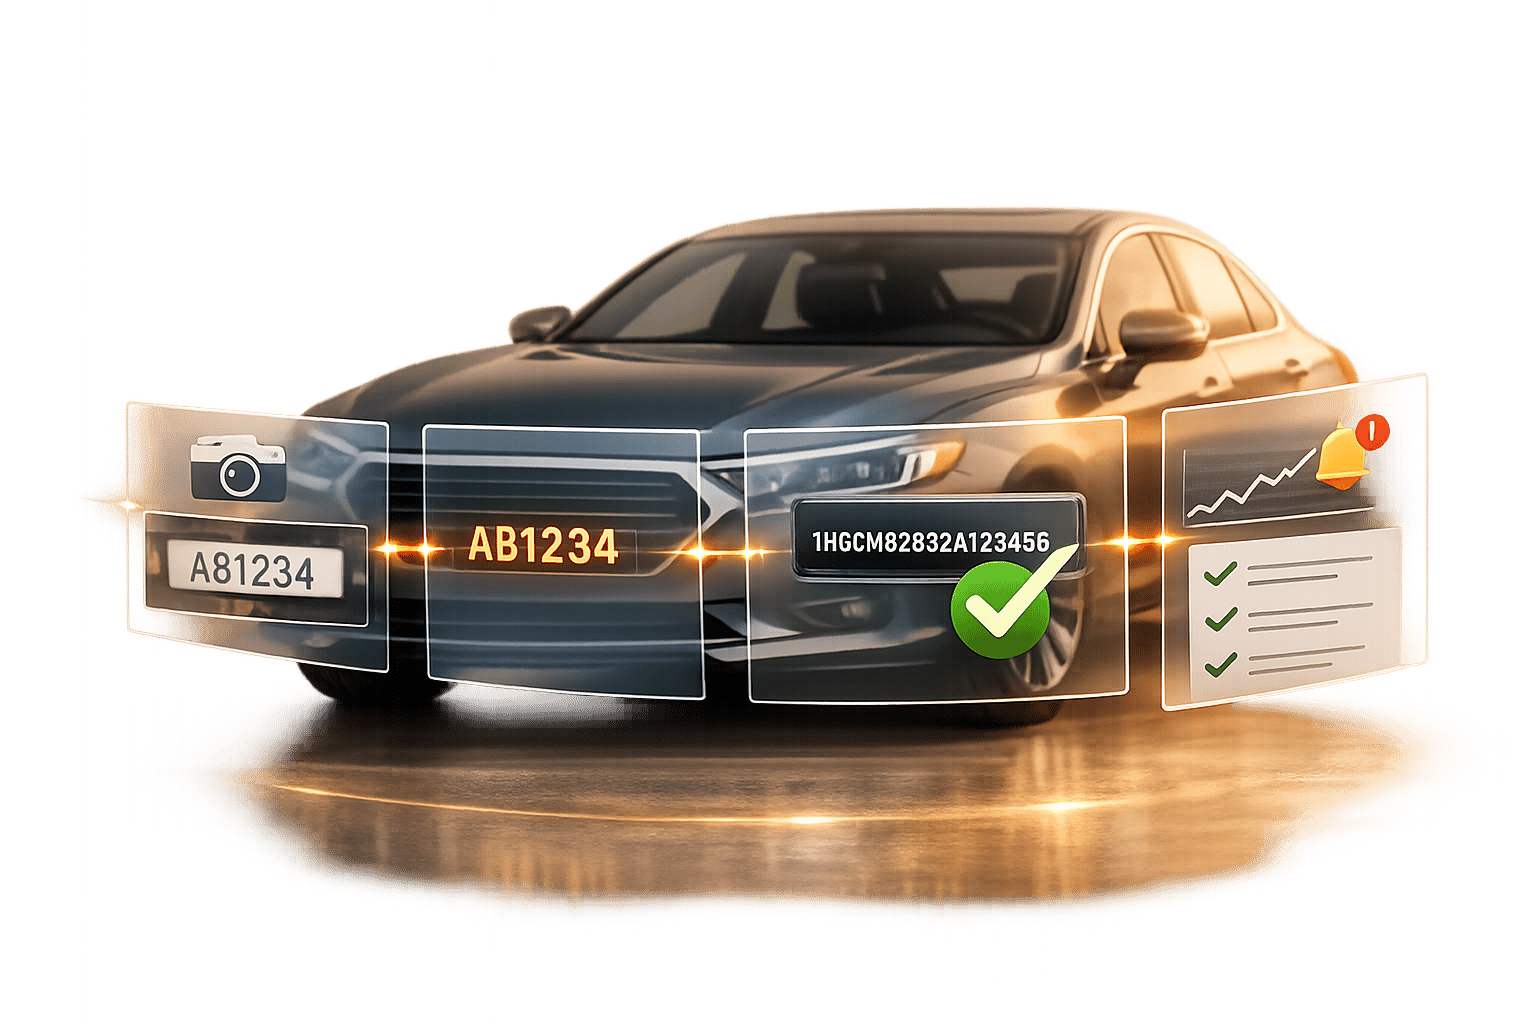
The process begins the moment an image enters the system, usually as a URL or a base64-encoded string [4][7]. The first task is object detection, which identifies the region containing the license plate or VIN and provides bounding box coordinates (xmin, xmax, ymin, ymax). Cropping this area isolates the relevant pixels, cutting down on noise and improving accuracy [12].
Next comes text extraction. A machine learning model reads the cropped region and extracts alphanumeric characters. Each result includes a confidence score ranging from 0 to 1. If the clarity of the text is questionable, the system might generate a ranked list of possible matches for further selection [7].
Post-processing takes the raw text and refines it into usable data. For example, a decoded license plate string or VIN can be passed to a decoder, which then returns structured vehicle details like make, model, year, engine size, and fuel type [7][9]. Services like CarsXE take this a step further by linking the decoded data to vehicle history, market value, and recall databases. This transforms a single image into a comprehensive vehicle profile. CarsXE’s Plate Image Recognition API, for instance, supports data extraction for over 100 countries and processes requests in approximately 226.9 milliseconds [7].
Pipeline Stage Output Purpose Image Input Raw image (URL or base64) Entry point for the pipeline [4][7] Object Detection Bounding box coordinates Identifies the plate or VIN region [4][7] Text Recognition (OCR) Extracted text + confidence score Reads characters from the cropped region [4][7] Post-Processing Corrected, validated text Fixes common errors (e.g., '0' vs. 'O') [12] API Integration Make, model, year, history, recalls Enriches raw text with detailed vehicle information [10][11]
The success of this pipeline often depends on the deployment method, which we’ll explore next.
Cloud, Edge, and Hybrid Deployments
Cloud deployments rely on remote servers to process images and return results via an API. This setup works well when compute needs fluctuate or when quick integration is a priority, even if occasional network delays occur [13]. While this may suffice for applications without strict time demands, it can be problematic in high-speed scenarios like border checkpoint cameras.
Edge deployments process data locally, either on an on-premise server or an embedded device. This approach ensures that sensitive data remains within the client’s infrastructure, making it a good fit for environments with strict privacy laws like GDPR or HIPAA. It’s also ideal for field operations where internet connectivity may be unreliable [13].
"For organizations processing identity documents, financial records, or any personal data subject to GDPR, HIPAA, or PIPL, on-device OCR is not merely an alternative - it is the architecturally correct default." - ocrstudio.ai [13]
Hybrid models combine the strengths of both approaches. Local processing handles tasks that require low latency, while cloud services manage centralized reporting and model updates [14]. For vehicle data applications, the choice between these models often depends on the need for speed and the sensitivity of the data. One way to optimize performance is by using regional API endpoints, which can reduce latency for users spread across different locations [8].
Key Metrics to Track for OCR Pipeline Health
Keeping an OCR pipeline running smoothly requires monitoring specific metrics to ensure it meets production standards. Once you understand how each stage of the pipeline operates, the next step is identifying the right metrics to track. These metrics will help you determine if your system is fast, accurate, and reliable enough for production use.
Performance Metrics
Two key metrics - latency and throughput - are essential for evaluating performance. Latency measures how long it takes for a user or system to receive a result, while throughput tracks how many images the pipeline can process in a given time before bottlenecks occur. However, relying solely on averages can be misleading. For example, while most requests might process in 300 milliseconds, 5% could still exceed 2 seconds, which is why monitoring p95 and p99 latency is crucial [16].
It’s also helpful to define latency targets based on input types. Consider a scanned PDF, which might have a latency goal of 500 milliseconds, compared to a low-light mobile photo, which could reasonably take up to 1,500 milliseconds [15]. Treating all inputs the same may result in unrealistic or overly lax thresholds.
Another vital aspect is error classification. Not all errors are created equal - a timeout indicates a transport issue, a service crash points to a platform failure, and a blurry image suggests a document quality problem [16][1]. Grouping these errors together can obscure where the system needs improvement.
Once performance metrics are under control, the next step is assessing model quality.
Model Quality Metrics
After stabilizing performance, accuracy becomes the primary focus. Two commonly used metrics are Character Error Rate (CER) and Word Error Rate (WER). CER measures how often individual characters are misinterpreted, while WER tracks the percentage of incorrect words. For clean text, a CER of 1–2% is ideal, but certain fields - like VINs - demand near-perfect accuracy, as even a single mistake can invalidate the data [17][19].
Improving field-level accuracy can significantly reduce the need for manual corrections.
Another useful tool is confidence scores, which provide a measure of certainty for each field. High-certainty fields (e.g., confidence scores ≥ 0.95) are correct 98% of the time, while fields with scores between 0.80 and 0.95 are about 92% accurate [3]. Many systems flag results with confidence scores below 0.75 for manual review if they occur repeatedly within a short timeframe, such as a 5-minute window [15].
Data Quality and Input Monitoring
The quality of input data plays a critical role in overall system accuracy. Often, poor input quality - like low resolution, motion blur, or bad lighting - causes extraction failures, not issues with the model itself [18]. Monitoring input quality separately from model performance helps pinpoint problems quickly and avoids unnecessary algorithm adjustments.
Key input metrics to track include:
- Image resolution: At least 300 DPI is recommended to distinguish between similar characters, such as "8" and "B" in a VIN [17].
- Skew angle: Tilted images can disrupt character alignment, requiring correction.
- Motion blur: This is especially problematic in scenarios like toll booths or parking garages, where rapid image capture is common [18].
Selective preprocessing can also improve results. For instance, upscaling low-quality JPEGs while skipping high-resolution PNGs can boost accuracy by about 15% on degraded images [3].
Lastly, keep an eye on input drift, where the characteristics of incoming data change over time. This might happen if a state introduces a new license plate design, a fleet switches camera models, or seasonal lighting conditions shift. While these changes may not cause immediate errors, they can gradually reduce accuracy. Monitoring layout entropy - the variability in structure and positioning of input data - can help detect these shifts early [5].
Tools and Strategies for Monitoring OCR Pipelines
Once you’ve defined the right metrics, the next step is setting up the infrastructure to track and respond to them effectively. The tools you use will play a big role in how quickly you can identify problems and understand what’s happening inside your OCR pipeline.
Logging, Metrics, and Distributed Tracing
Popular tools like Prometheus and Grafana are often used for OCR monitoring. Prometheus gathers data by scraping a /metrics endpoint on your service. It collects counters, gauges, and histograms for metrics such as ocr_requests_total, active requests, and p95 latency. Grafana then takes this data and visualizes it through real-time dashboards [20][24].
If your pipeline spans multiple services, OpenTelemetry (OTEL) can be a game-changer. It provides distributed tracing, allowing you to track a single OCR request as it moves through preprocessing, model inference, and post-processing stages [20]. Pair this with structured logging tools like structlog to create JSON logs, which can be easily searched and filtered in systems like the ELK stack [21][24].
Health endpoints are another essential part of monitoring. Implement endpoints such as /health/live to show service status, /health/ready to verify GPU readiness, and /healthz to expose real-time metrics like active_requests, queued_requests, and free_vram_mb [22][23].
For vehicle OCR pipelines that integrate with CarsXE for VIN decoding or license plate lookups, it’s important to log key metrics. This includes the candidates array, which lists alternative character readings. For example, this can help flag ambiguous results, like distinguishing between "O" and "0" in a VIN string [4][7].
"The confidence of a result is the algorithm's confidence in the probability that our response is correct." - CarsXE [7]
These foundational monitoring practices pave the way for proactive alerting and more advanced checks.
Setting Up Alerts and Thresholds
Static thresholds are a good starting point, but a more effective alerting strategy uses multiple tiers. Here’s a practical breakdown of alert levels [26]:
- Page-worthy: Alerts that demand immediate attention, such as availability dropping below 99.9% or error rates exceeding 5%.
- Ticket-worthy: Issues that need to be investigated within a few hours, like p95 latency breaches or a daily cost increase of more than 15%.
- Informational: Alerts for weekly reviews, covering trends like drift signals or changes in golden test set pass rates.
For vehicle OCR, it’s better to define source-specific latency SLAs rather than applying a single threshold across the board [15]. Similarly, set alerts for average confidence scores dropping below 0.75 over a rolling window. Be sure to filter out placeholder values, such as Tesseract’s -1 for empty text, to avoid false positives.
High-priority alerts should always include details like the affected subsystem, what changed, the severity level, and suggested actions [25].
"In safety-critical AI, the most valuable alert is often the one that arrives before a metric crosses the official threshold. Build for leading indicators, not just threshold breaches." - Daniel Mercer, Senior AI Systems Editor [25]
Alerts are just one piece of the puzzle. Domain-specific checks are also critical for ensuring the accuracy and reliability of your OCR pipeline.
Monitoring Checks for Vehicle OCR
Beyond general metrics and alerts, specialized checks are crucial for handling the unique challenges of vehicle data processing.
Start with VIN checksum validation. A VIN that passes OCR extraction but fails its check digit can introduce silent errors into downstream systems. Similarly, use license plate pattern matching to compare results against state-specific formats. This helps catch character confusion issues, like mistaking "1" for "I", before the data enters your database [2][6].
When working with CarsXE for VIN or license plate lookups, monitor the API’s success field closely. Track its success rate alongside the confidence score to assess the performance of external providers. If these metrics drop without changes to your input data, it’s a sign that further investigation is needed [4][7].
For GPU-accelerated pipelines, keep a close eye on free VRAM. Many systems require at least 4,096 MB of free VRAM to handle new OCR tasks. Falling below this threshold can lead to out-of-memory crashes if proper admission controls aren’t in place [22]. To manage resources and costs, automate the termination of GPU workers that have been idle for 30 minutes [22].
Keeping OCR Pipelines Stable and Accurate Over Time
Detecting and Handling Drift
Even the best-tuned OCR systems can falter if left unchecked. Changes in input data - like updated license plate designs, new camera hardware, or altered document layouts - can gradually erode accuracy.
One way to catch this early is by monitoring confidence scores over rolling time frames. A steady drop in average confidence often signals drift well before error rates become noticeable. It’s also smart to track performance by document template. Why? Because a single problematic layout can drag accuracy down for that template, even if the overall average seems fine. For example, a Character Recognition Rate (CER) error of just 5% can cause end-to-end accuracy for 17-character VINs to dip below 75%, highlighting how small issues can snowball into major problems [6].
"A typical VIN contains 17 characters, and it's enough to miss one of them to classify the prediction as wrong." - Grape Up [6]
Regional variations add another layer of complexity, especially for vehicle OCR. License plate formats differ by state and can change over time. By tracking performance regionally, you can spot localized issues before they spread.
This early detection naturally sets the stage for targeted updates and ongoing maintenance.
Continuous Training and Feedback Loops
Combatting drift effectively means setting up a robust feedback loop. Start by flagging outputs with low confidence scores and feeding them back into your training pipeline.
For example, CarsXE’s high-confidence VIN and license plate data can act as your ground truth. If your OCR output clashes with a verified CarsXE lookup, that mismatch becomes a valuable labeling signal. The candidates array, which lists alternative character predictions with their respective scores, is especially helpful for identifying recurring errors - like mixing up "O" and "0" or "I" and "1" [4][7]. Feeding these patterns into your training data directly addresses frequent mistakes.
This iterative approach has proven results. In July 2025, the Global Data team at CARS24 applied it to their workflows, boosting entity extraction accuracy from 70% to over 90% for dense documents. They also slashed inference times from 1.5 seconds to under 500ms [2].
"Real-world ML isn't just about model accuracy - it's about engineering, experimentation, and iteration." - Pritishrv, CARS24 Data Science Blog [2]
Runbooks and Routine Maintenance
Once you’ve tackled drift, having a clear incident response plan is key. Without detailed runbooks, on-call engineers can face confusion, especially during late-night emergencies. Runbooks should outline how to handle common issues like frozen GPU memory, queue bottlenecks during traffic spikes, and degraded mode protocols (e.g., switching to local queue-only mode if API latency exceeds a set threshold for five consecutive minutes) [27].
Routine maintenance is just as critical. Each new model release should be back-tested against historical data. Use these results as release gates - if a key metric, like the field exact match rate, drops below your target (e.g., ≥99% for stable fields like IDs), block the deployment automatically [5]. It’s also worth keeping tabs on CarsXE API updates. Features like expanded VIN OCR capabilities or updated confidence scoring can alter how your pipeline processes results. Staying in sync with these updates helps avoid unexpected mismatches [4][8].
Conclusion
Keeping an OCR pipeline running smoothly takes constant vigilance. From keeping an eye on latency percentiles and confidence scores to spotting drift before it undermines accuracy, maintaining a real-time vehicle OCR system involves managing infrastructure, model performance, data quality, and operational workflows.
The main takeaway here is simple: having visibility into every stage of the pipeline is the key to building a dependable system. Small dips in confidence scores, a few more invalid VIN formats, or a bump in P95 latency - these are the early warning signs that only active monitoring can reveal.
When it comes to vehicle data applications, OCR acts as the gateway. If plate or VIN recognition falters, the entire downstream process suffers, including the enriched data your users rely on. To safeguard this process, tools like CarsXE can help verify data integrity. For example, a VIN that fails its checksum or doesn’t return a valid record signals a need for immediate review. Monitoring the downstream decode success rate - the percentage of OCR results that successfully map to real vehicle data - is one of the most actionable and business-critical metrics you can track [7][9].
Drift is unavoidable. Changes in license plate designs, seasonal lighting variations, or updates to camera hardware will inevitably affect inputs over time. The most effective teams prepare for this by building feedback loops, maintaining labeled test sets, and treating drift detection as a regular KPI.
Runbooks, release gates, and planned health checks can keep your OCR system reliable - even when the unexpected happens. By prioritizing monitoring, you lay the groundwork for long-term accuracy and consistent performance.
FAQs
Which OCR metrics should I prioritize for alerts?
When evaluating system performance and user experience, it's essential to concentrate on metrics that highlight both system health and the impact on users. Here are the key ones to keep an eye on:
- Throughput: Keep track of how many documents are processed per minute. This helps identify bottlenecks that could slow down operations.
- Confidence Scores: Set up alerts for documents that fall below a specific confidence threshold. Dig deeper by tracking field-level scores to pinpoint where issues might be occurring.
- Error Rates: Monitor errors and retries closely. This can help uncover recurring problems that need attention.
- Latency: Measure end-to-end processing times, especially the p95 (95th percentile) latency. This gives a clear picture of user experience and helps ensure timely responses.
- Resource Utilization: Keep an eye on memory and CPU usage. This is crucial for avoiding system crashes and maintaining smooth operations.
By focusing on these critical metrics, you can ensure your system runs efficiently while delivering a positive experience for users.
How can I differentiate model accuracy issues from poor image quality?
To figure out if problems stem from model accuracy or poor image quality, it's helpful to separate detection errors from recognition errors. If the text can't be detected at all, the issue might be related to layout problems, such as skewed alignment or improper cropping. On the other hand, if the text is located but misread, it usually points to recognition errors or severe image degradation.
Implementing quality checks can help. Assess factors like blur, contrast, and resolution using quality gates. Additionally, validating the extracted data against expected formats can help zero in on the exact cause of the issue.
What’s the best way to catch VIN errors automatically?
To minimize VIN errors, combine clear user guidance with backend validation processes. Leverage the CarsXE VIN OCR API to extract 17-character VINs while also providing confidence scores and error feedback. Implement strict validation rules: VINs must always be 17 characters long and cannot include the letters I, O, or Q. Boost precision further by verifying manufacturer codes and check digits instantly. Additionally, offer helpful image capture tips such as framing guides or auto-flash prompts to ensure quality input from the start.
Related Blog Posts
- How to Choose an OCR Engine for Vehicle Data
- Study: OCR Accuracy in Vehicle Data Processing
- 5 Steps to Build Vehicle OCR Pipelines
- Future of Synthetic Data in Vehicle OCR